
With immigration a central focus in the public and policy conversations in the United States, it is important to have a solid understanding of the immigrant population. This explainer offers statistics on the immigrant population’s size, origins, places of U.S. settlement, and pathways of arrival.
It also looks at legal statuses, as this has been a topic of significant public interest and confusion.
More than three-quarters of immigrants are in the United States legally, as naturalized citizens, legal permanent residents (aka green-card holders), refugees and asylees, or individuals on long-term temporary (aka nonimmigrant) visas.
The Size of the Immigrant Population
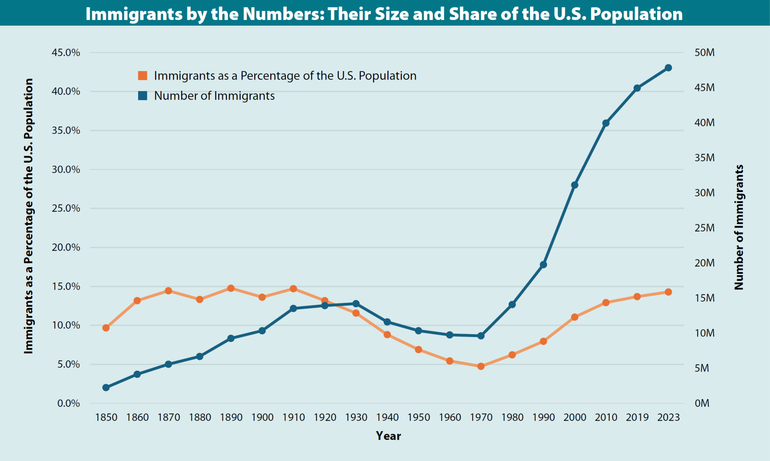
The United States is home to the world’s largest foreign-born population: More than 47.8 million people as of 2023, according to the most recent data from the U.S. Census Bureau. Immigrants represented 14.3 percent of the 335 million U.S. residents in 2023—near the historical high of 14.8 percent in 1890.
As the number of immigrants has risen significantly since the lowest share hit in 1970, their number of U.S.-born children also has increased. As of 2023, 17.9 million children under age 18 (or 26 percent of all children in the United States) had a parent who was foreign born.
Collectively, immigrants and their U.S.-born offspring (of all ages) numbered approximately 90.9 million people, or 27 percent of the total civilian U.S. population in 2023. Students from immigrant families (whether themselves immigrants or born in the United States) accounted for more than 90 percent of college enrollment increases between 2000 and 2022. And all growth in the U.S. labor force between 2000 and 2023 came from immigrants and their offspring.
The Many Terms to Describe Immigrants
Different terms are used to describe people born abroad who are in the United States to live, work, study, or seek protection permanently or temporarily: immigrant, migrant, noncitizen, alien, and foreign born, among them. There are subcategories in this population that connote a particular immigration status, including naturalized citizen, legal permanent resident, refugee, and asylee.
The terms all refer to individuals who were not born on U.S. soil (or were born abroad but cannot claim citizenship via a U.S. parent).
Foreign-born persons need a permit (visa) from the U.S. government to live in the United States, unless they have become U.S. citizens via the naturalization process. Noncitizens crossing the border without authorization or overstaying their visa are referred to as unauthorized immigrants, with some calling them illegal immigrants, irregular migrants, or even illegal aliens.
This explainer draws on data from the U.S. Census Bureau and the Department of Homeland Security’s Office of Homeland Security Statistics and uses the terms “immigrant” and “foreign born” interchangeably.
Sorting Through Immigrant Statuses
Seventy-seven percent of immigrants in the United States as of 2022 held permanent legal status (as a naturalized citizen, refugee or asylee, or green-card holder) or a long-term nonimmigrant visa (international students and temporary workers among them), according to the Pew Research Center.

The unauthorized immigrant population, which the Migration Policy Institute (MPI) estimated at 11.3 million people as of mid-2022, has not shown evidence of a dramatic surge over the past decade because there is population churn. Some unauthorized immigrants are deported or leave voluntarily; others die; and some are able to legalize their status. Most unauthorized immigrants have resided in the United States for more than 10-15 years. (Note: The MPI estimates are in line with those from the several other organizations that have developed authoritative methodologies to estimate the size of this population). There are new entrants, though, with the increased use of humanitarian parole programs (which permit temporary stay and may grant eligibility for a work permit but not a path to legal permanent residence or U.S. citizenship) such as for Cubans, Haitians, Nicaraguans, and Venezuelans. (It is likely that the rise in migrant arrivals at the border and through humanitarian parole programs since 2022 has increased the size of the unauthorized and quasi-legal immigrant population. However, the exact size of the increase depends on how many recent entrants have stayed and on how many longer-term unauthorized immigrants may have returned home.)
Pathways to U.S. Permanent Residency
There are four main pathways to obtain U.S. permanent residency: through family or employer sponsorship, humanitarian protection, or the Diversity Visa lottery for nationals of countries with low levels of immigration to the United States. The U.S. system, somewhat uniquely among major immigrant-receiving countries, prioritizes family reunification rather than employment needs. Of the nearly 1.2 million immigrants receiving a green card in fiscal year (FY) 2023, 64 percent were either immediate relatives of U.S. citizens or other family-sponsored immigrants. About 17 percent were sponsored by their employer or self-petitioned (including investors who create jobs).

Changing National Origins
As the top destination for migrants worldwide, the United States attracts immigrants from all over the world. While in the past most immigrants were from Europe, the origin countries have changed significantly since the last major overhaul of the U.S. immigration system in 1965 (with amendments in 1990). Today, just over half of U.S. immigrants are from Latin America, with Mexico accounting for 23 percent alone. Nearly one-third are from Asia.
The make-up of the U.S. immigrant population continues to evolve. Beyond a diversification that began in 2010 with rising immigration from northern Central America (El Salvador, Guatemala, and Honduras), immigration from beyond the region has accelerated. Immigrants from South America grew three times faster than the overall immigrant population between 2010 and 2023 (61 percent versus 20 percent, respectively). Immigration also has increased from Africa (growing by 74 percent since 2010) and from Asia (29 percent increase since 2010).

Top Destinations in the United States
The states with the most immigrants in 2023 were California (approximately 10.6 million), Texas (5.5 million), Florida (5.0 million), New York (4.5 million), and New Jersey (2.3 million). Certain origin groups are highly concentrated in certain geographic areas. For instance, 73 percent of all Cubans resided in Florida, and so did 46-47 percent of Venezuelans and Haitians. Forty-nine percent of Iranians lived in California, and so did 46 percent of Taiwanese. Of all immigrants from Guyana, 56 percent lived in New York, and so did 41 percent of immigrants from Bangladesh.


Resources
- American Immigration Council, How the United States Immigration System Works, June 2024
- Migration Information Source, Frequently Requested Statistics on Immigrants and Immigration in the United States, March 2024
- Pew Research Center, What We Know about Unauthorized Immigrants Living in the U.S., July 2024
- Migration Policy Institute, Diverse Flows Drive Increase in U.S. Unauthorized Immigrant Population, July 2024
- Migration Policy Institute, Explainer: How the U.S. Immigration System Works, April 2019
Download Explainer
Please visit:
Our Sponsor